

Everything a sent campaign achieved is readable from the Targeted Campaign List page without opening the campaign. The table carries 3 numeric columns that follow the customer from receiving the message through to using the coupon. About 5 minutes per review round, and nothing in this article changes any campaign data.
⚡ Quick Path:
Targeted Campaign→ thePublishedchip → readReached,ClickedandUsedon that campaign's row → pressView Reportif you need more detail
Requirements before you start
- Access to Targeted Campaign — if it isn't in your left sidebar, ask an Admin on your team to grant it first.
- At least one campaign already sent — figures only appear for campaigns with a
Publishedstatus. - A record of which group each round went to — the table gives you numbers but not the reason behind them. The context about audience and timing has to come from your team's own notes.
📌 Good to know: these figures are per campaign, not a brand-wide view. For monthly totals like member counts or sales, use the monthly summary dashboard instead.
Read campaign results in 3 steps
1. Open the list and filter to what's been sent
In the left sidebar, click Targeted Campaign to reach Targeted Campaign List.
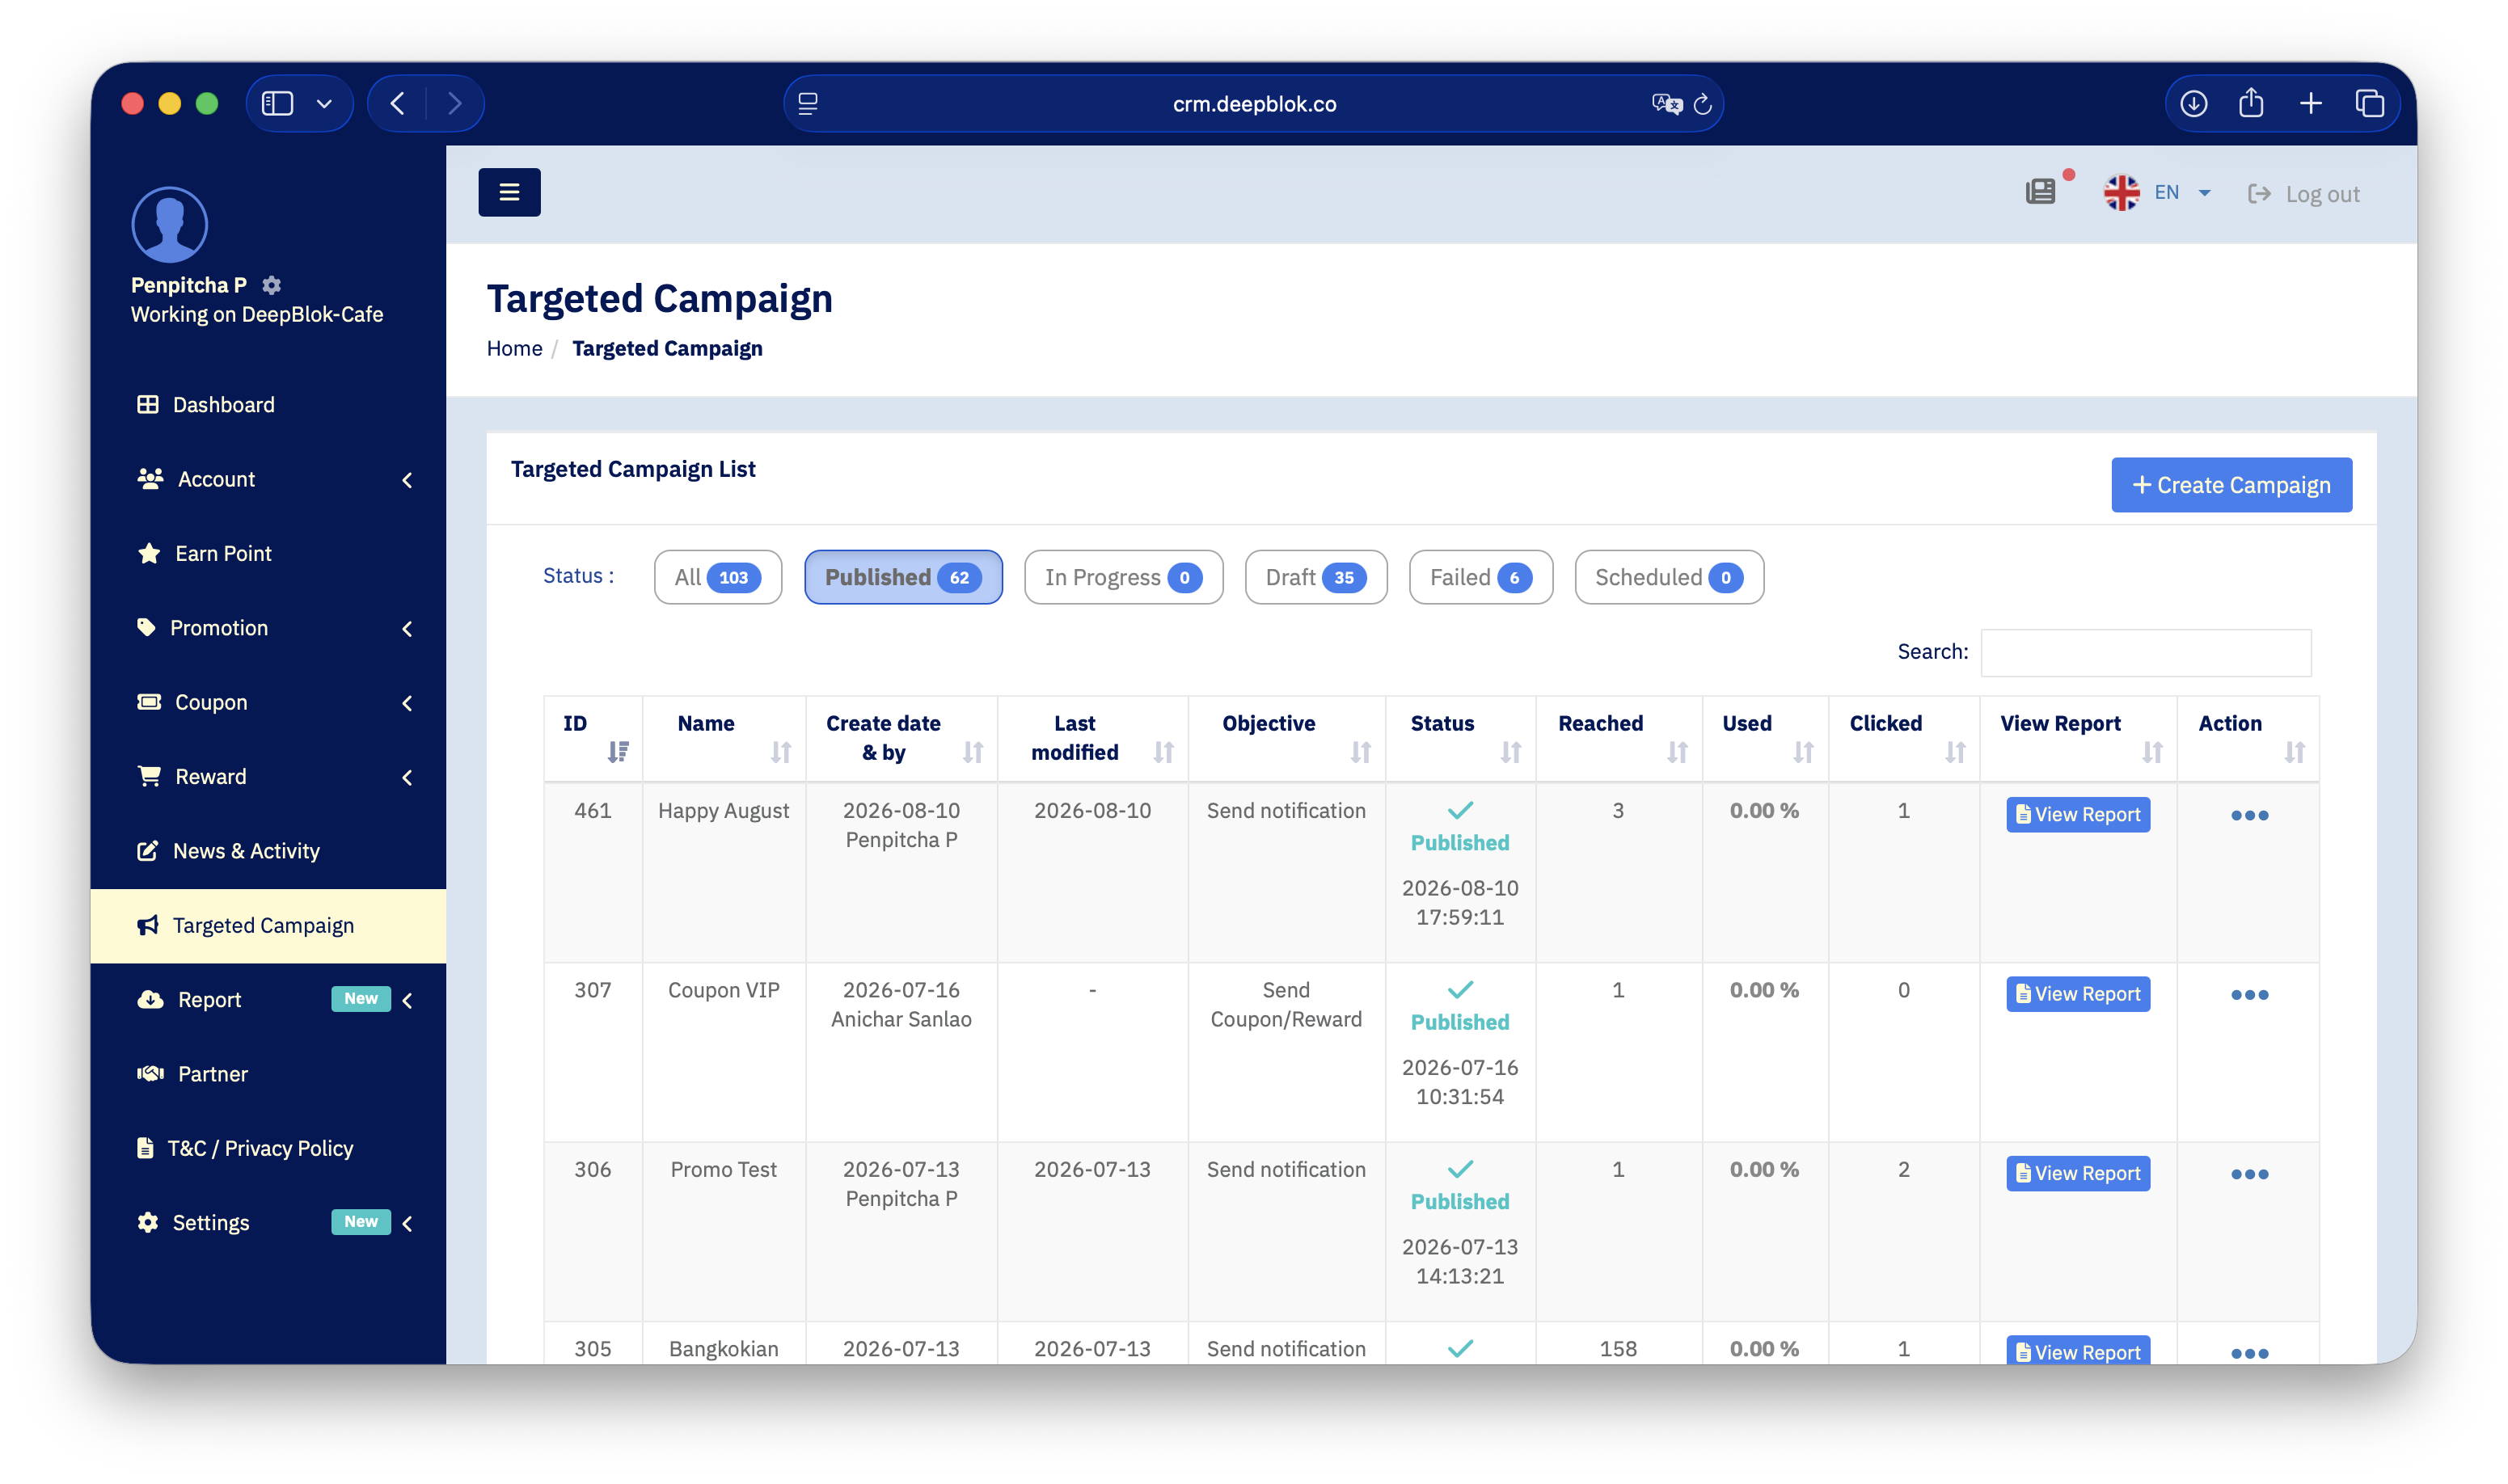
Above the table sit 6 status chips, each with a count. Click Published to filter to the campaigns that have actually gone out — the only status with results to read.
The other chips earn their place in a review too. Fail tells you which rounds didn't complete, and Scheduled tells you what's still queued. Open all 3 in each review round.
2. Read the 3 columns left to right
The 3 columns happen to line up with the customer's journey — received, tapped, used. Read them in that order.
Other columns on the same row fill in the context: Name, Create date & by, Objective (coupon campaign or notification campaign), and Status, which shows the real send timestamp beneath the word Published.
3. Open View Report when you need more
To the right of each row sits a View Report button that opens that campaign's own report. The Action column, the 3 dots, manages the row itself.
For a weekly or monthly review, the 3 table columns are usually enough — they let you compare across campaigns on one screen. Open an individual report when a campaign's figures are far enough from expectation that you need to find out why.
✅ Check your understanding: a campaign with high
Reachedbut very lowClickedmost likely has a copy-and-artwork problem, not an audience problem. HighClickedbut lowUsedmost likely has a reward or redemption-conditions problem. If you can answer both without scrolling back, you're ready to use this table on real work.
Note on reading the figures: they show where people dropped out, not why
The 3 columns are most useful read as a sequence, because the gaps between them are where customers fell away.
Recommendation: change one variable per round. Change the audience, the send time and the reward at once and a better number won't tell you which one did it.
Common Problems
Frequently Asked Questions
Q: What is Used a percentage of?
A: It reports the coupon use rate as a percentage. The screen doesn't state the denominator — whether it's coupons issued or customers reached. The safe use is comparing your own campaigns against each other, which share whatever basis it is, rather than converting it back into a number of coupons.
Q: How often do the figures update?
A: The screen doesn't state a refresh cycle. In practice, check again the next day before drawing conclusions about a fresh campaign — especially Used, which depends on customers coming in over several days.
Q: How often should I review campaign results?
A: A cadence that works for most brands is weekly for Reached and Clicked, which settle quickly, and monthly for Used, since coupons live longer. Write the figures down each round — the table shows only the current value and keeps no history to compare against.
Q: What should I do about a campaign showing Fail?
A: Check 2 things first: the reward's remaining code count, and whether the reward is still active. Then build a new campaign, since the screen states only Draft items are editable.
Next Step
Campaign-level figures tell you which round worked, but not whether the business is better off — the next thing to do is open the monthly summary dashboard and compare a month with heavy campaign activity against one without, because that's the number that answers whether the campaigns are worth running.
Read Next